
二つのグループに違いがあるのか、解析する機会は非常に多いと思います。
本記事では二つのグループの平均(もしくは順位)の違いを比較する方法について紹介します。
全体の流れ
二つのグループの比較を行う際の全体の流れは以下の通りです(参考文献)。
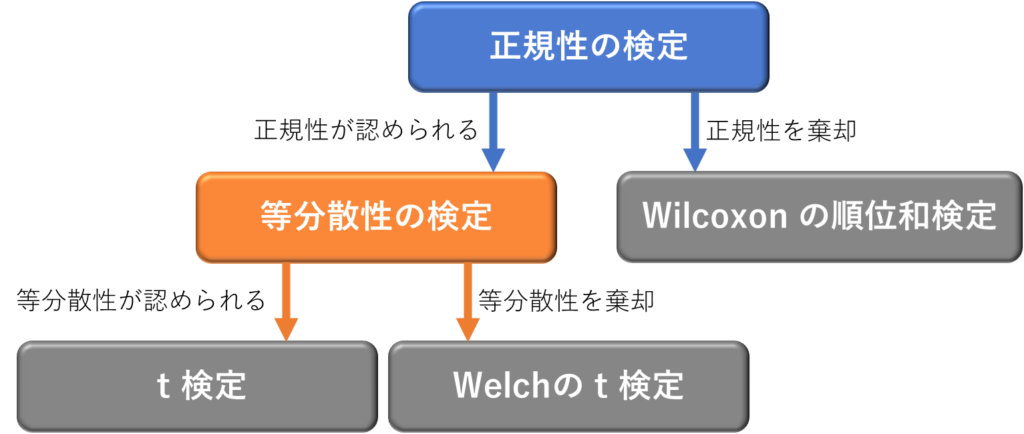
正規性の検定
各グループの正規性を検定する方法の一つとしてはShapiro-Wilk検定があります。
Shapiro-Wilk検定は帰無仮説が「このデータは正規分布に従う」であるため、P値が有意水準を上回った場合に、正規分布ではないとはいえない(≒正規分布している)と考えます。
Shapiro-Wilk検定をRで実施する方法は以下の通りです。
「shapiro.test(データ(ベクトル形式))」
<sample data>
> dat
    A   B
1  40 100
2  50 101
3  47  83
4  39  75
5  46  84
6  48 108
7  49  90
8  41 105
9  52 108
10 76  81
<e.g.>
> shapiro.test(dat$A)

	Shapiro-Wilk normality test

data:  dat$A
W = 0.75877, p-value = 0.004564

#p<0.05なので正規性はない
> shapiro.test(dat$B)

	Shapiro-Wilk normality test

data:  dat$B
W = 0.90005, p-value = 0.2194
#p>0.05なので正規性はないとはいえない等分散性の検定
各グループ間の等分散性を検定する方法の一つとしてはF検定があります。
F検定は帰無仮説が「二つのグループには等分散性がある」であるため、P値が有意水準を上回った場合に、等分散ではないとはいえない(≒等分散している)と考えます。
F検定をRで実施する方法は以下の通りです。
「var.test(グループ1,グループ2)」
<sample data>
> dat
    A   B
1  45  94
2  50  96
3  48 104
4  39  96
5  47  99
6  46  96
7  38 104
8  67 109
9  67 112
10 58 111
<e.g.>
> var.test(dat$A,dat$B)

	F test to compare two variances

data:  dat$A and dat$B
F = 2.2881, num df = 9, denom df = 9, p-value = 0.2334
alternative hypothesis: true ratio of variances is not equal to 1
95 percent confidence interval:
 0.5683405 9.2120205
sample estimates:
ratio of variances
          2.288136
#p>0.05なので等分散性はないとはいえない正規性が認められた場合:t検定
正規性が認められた場合、二つのグループはt検定を用いて比較します。
等分散性が認められない場合はwelch の t 検定を用います。
t検定をRで実施する方法は以下の通りです。
・等分散性が認められる場合
「t.test(グループ1,グループ2,var.equal=T)」
・等分散性が認められない場合
「t.test(グループ1,グループ2,var.equal=F)」
※デフォルトはvar.equal=Fです。
<sample data>
> dat
    A  B
1   1  5
2   3 21
3   4 11
4  11  3
5  15 23
6   2  3
7   5 26
8  11 24
9   4  6
10 25 25
<e.g.>
#t検定
> t.test(dat$A,dat$B,var.equal = T)

	Two Sample t-test

data:  dat$A and dat$B
t = -7.8501, df = 18, p-value = 3.205e-07
alternative hypothesis: true difference in means is not equal to 0
95 percent confidence interval:
 -51.46583 -29.73417
sample estimates:
mean of x mean of y
     51.5      92.1

#Welchのt検定
> t.test(dat$A,dat$B,var.equal = F)

	Welch Two Sample t-test

data:  dat$A and dat$B
t = -7.8501, df = 17.661, p-value = 3.647e-07
alternative hypothesis: true difference in means is not equal to 0
95 percent confidence interval:
 -51.4808 -29.7192
sample estimates:
mean of x mean of y
51.5 92.1 正規性が認められなかった場合:wilcoxonの順位和検定
正規性が認められなかった場合、二つのグループはwilcoxonの順位和検定を用いて比較します。
wilcoxonの順位和検定をRで実施する方法は以下の通りです。
「wilcox.test(グループ1,グループ2)」
<sample data>
> dat
    A  B
1   1  5
2   3 21
3   4 11
4  11  3
5  15 23
6   2  3
7   5 26
8  11 24
9   4  6
10 25 25
<e.g.>
> wilcox.test(dat$A,dat$B)

	Wilcoxon rank sum test with continuity correction

data:  dat$A and dat$B
W = 30, p-value = 0.1388
alternative hypothesis: true location shift is not equal to 0
#p>0.05なので二つのグループに有意な差があるとはいえない

W = 0.82232, p-value = 0.02704とはいえないおわりに
本記事では二つのグループの平均(もしくは順位)の違いを比較する方法について紹介しました。
私の記事が皆様のお力添えになれば幸いです。

コメント